Does anyone know of any helpful and tangible resources/practices/programs for learning how to R-Code? I did locate the following resource(s): Introduction to R for Data Science
The goal is to become fluent in R. Thank you! ![]()
Does anyone know of any helpful and tangible resources/practices/programs for learning how to R-Code? I did locate the following resource(s): Introduction to R for Data Science
The goal is to become fluent in R. Thank you! ![]()
Hi @gio,
I am happy to help! I see you are at CCC, is that correct? It would help me help you better if I understood a little more about the why behind your question.
What previous experiences with R do you have (ex. miniCURE coding on SciServer, other coding experience), and what is the end goal for learning R? For example, are you looking to move to RStudio for more advanced usage or is it more just wanting to be able to read the code more fluently?
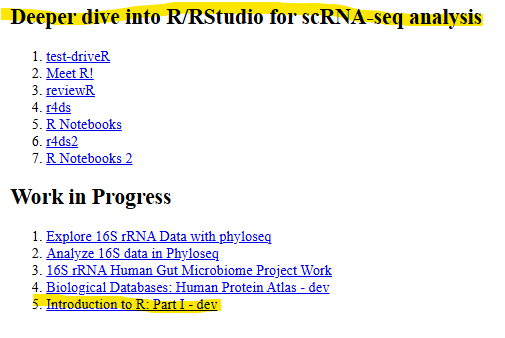
We have the modules under the section titled “Deeper dive into R/RStudio for scRNA-seq analysis” and the “Introduction to R: Part I - dev” modules on SciServer that are aimed at students who are looking to get a deeper understanding of the code.
Hello! Thank you for your response! Yes, I am a student at CCC wanting to learn and better understand/grasp R. I am a novice/beginner to R and believe that it would be so useful to learn, as well as become fluent since my professional goal involves scientific research. I am also learning to navigate the C-MOOR website, as well as SciServer. I briefly used R when conducting research for a project involving the D. melanogaster midgut.
To confirm, one can get into those modules by logging into SciServer and clicking “Compute.” After that, we have the option(s) to choose the following (see highlighted):
It sounds as though RStudio is advanced - I am interested in getting to this point but am aware that baby steps (such as undergoing the recommended modules) must be taken first, correct? My goal is not only to become fluent in R but to gain valuable, in-demand (within the scientific community), skills and knowledge. If you have any recommendations, I would be grateful! Thank you!
Yes, that’s correct. We try to have students do as much of the work as possible away from RStudio as it helps use troubleshoot (all computing environments are the same on SciServer). So far as I know the only students we have using RStudio at the moment are using it to get higher resolution figures and/or using more specialized datasets.
I think learning R is a great idea given your goals. It’s a relatively easy language to translate to and from English and is conceptually very similar to many other languages like Python. Your first computing language is always the hardest but you will be able to pick up new ones much more easily as you get more comfortable.
The highlighted sections in your screenshot are correct. I’ll note here that we didn’t design them to necessarily flow naturally into each other, so they are more of a collection of lessons than a full curriculum. Some of them will teach you the same concept but in slightly different ways. I suggest these modules in this order:
Introduction to R: Part I - dev and Meet R!
reviewR and r4ds2
The first two go over some of the basic functions of R; what it can do to crunch numbers, store data, and some of the basics of object oriented programming. The last two focus more on manipulating data frames and using ggplot. You can ignore the parts where it talks about R Notebooks, although you should keep a record somewhere of your thoughts, questions, and understanding as you go through everything.
Here are some challenges I have had students try in the past. It tests out your understanding of how to manipulate and graph data using the cars and iris datasets that come preloaded in R (they can be called by just typing in either cars or iris) using basic R plots and then when you feel comfortable, plotting in ggplot (for which R Graph Gallery is your go-to-reference). You don’t have to do all the plots below or go in order, and can pick and choose what you’d like to try.
Can you give the modules and some of these challenges a go and see how you fare? Feel free to reach out here for help or to check in as you go through everything. Some of the harder ones use the subset function from dplyr which we should have loaded in SciServer (may need to load the package with library(tidyverse). Let me know if you need help when you get here).
| Difficulty | Asking for |
|---|---|
| Low | A scatterplot showing the relationship between the mpg and weight (wt) of a car |
| Low | A scatterplot showing the relationship between the mpg and # of cylinders (cyl) of a car |
| Low | A scatterplot showing the relationship between the mpg and # of 1/4 mile time (qsec) of a car |
| Low-Medium | The summary of cars with a mpg of over 25 mpg |
| Medium | A scatterplot showing the relationship between petal length and width for versicolor irises |
| Medium | A scatterplot showing the relationship between petal length and width for setosa irises |
| Medium | A scatterplot showing the relationship between petal length and width for irises with a sepal length of equal to or over 5 cm |
| Medium | Using the histogram function (hist(object$column)) a histogram of cars by gross horsepower (hp) |
| Medium | Using the histogram function (hist(object$column)) a histogram of irises by sepal width |
| Medium | Using the boxplot function (boxplot(x~y), object) plot the relationship between petal length and iris species |
| Hard | Using the boxplot function (boxplot(x~y), object) plot the relationship between gross horsepower (hp) and engine shape (vs) |
| Hard | Using the histogram function (hist(object$column)) a histogram of irises by sepal width only for irises that have a petal width greater than 1.2 cm |
| Hard | The summary of cars with a mpg of over 25 mpg and a weight (wt) over 2 |
Hi @gio ,
How are you doing?
Just checking in on this and seeing if there’s anything you need help with.