You have a barplot, but your samples are out of order; perhaps you want to reorder them by an experimental condition BUT you don’t want to merge samples. This code will conserve the original sample data by individual and rearrange samples on the x-axis.
It uses both melt and glom (which we have seen in some other code recipes here), which alters the original dataset so it should be used on its own and not carried over to a different analysis. One advantage of this is that the object will become much more lightweight - creating a barplot using a phyloseq object that has a lot of ASVs or samples will be much more computationally taxing than using the glommed/melted dataframe.
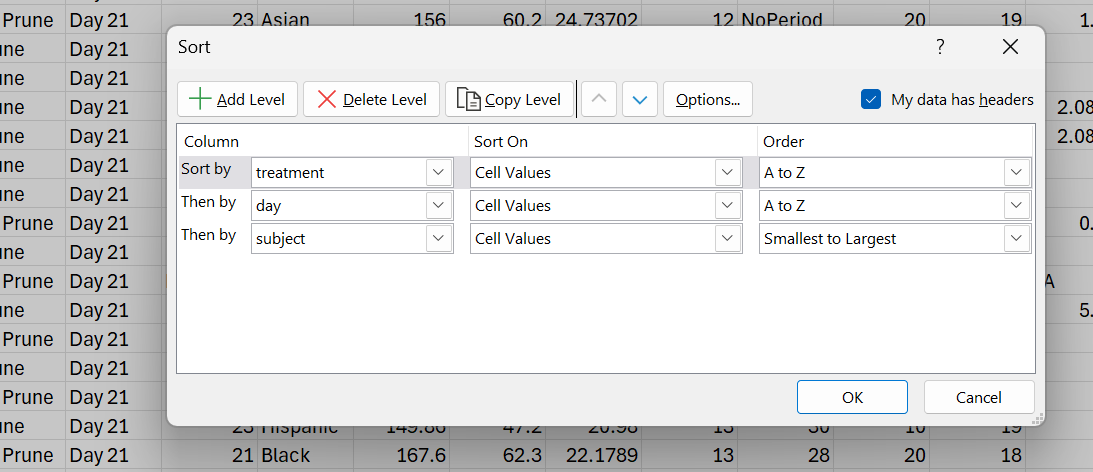
As you can see, you will also need to provide the exact order you want the samples in. I did this by reordering the samples using the sort function in a spreadsheet software (Excel in this case). @gauriipaul you have this file in your dataset folder on the drive already (Terrazas.xlsx, under the samdf tab). I sorted by multiple levels in this case, to group samples by treatment, then within treatment by day, and within the day category by the subject.
You then have to take this list and make a vector out of it. It’s a little tedious, but easy:
#Rearranging samples in barplotdesiredOrder ← c(“701C”, “702C”, “705C”, “706C”, “916C”, “917C”, “918C”, “919C”, “920C”,“921C”, “922C”, “923C”, “924C”, “925C”, “926C”, “927C”, “928C”, “929C”,“930C”, “701C2”, “702C2”, “705C2”, “706C2”, “918C2”, “919C2”, “921C2”,“922C2”, “923C2”, “924C2”, “925C2”, “926C2”, “927C2”, “928C2”, “929C2”,“732N”, “734N”, “735P”, “736N”, “737P”, “739N”, “740P”, “741P”, “742P”,“743P”, “744P”, “947N”, “948N”, “949N”, “950N”, “951N”, “952P”, “953P”,“954P”, “955N”, “956N”, “957P”, “958P”, “960N”, “962P”, “963P”, “966N”,“967N”, “970P”, “971P”, “972P”, “973P”, “975N”, “978P”, “980N”, “981P”,“982N”, “983N”, “984N”, “985P”, “986N”, “987P”, “988P”, “989N”, “990P”,“732N2”, “735P2”, “736N2”, “737P2”, “739N2”, “741P2”, “742P2”, “947N2”,“948N2”, “949N2”, “950N2”, “951N2”, “952P2”, “953P2”, “954P2”, “955N2”,“956N2”, “957P2”, “958P2”, “960N2”, “962P2”, “963P2”, “970P2”, “971P2”,“972P2”, “973P2”, “975N2”, “978P2”, “979N2”, “981P2”, “984N2”, “985P2”,“986N2”, “988P2”, “989N2”, “990P2”)
glom ← tax_glom(oc, taxrank = ‘Phylum’)glom # Squish all ASVs of the same Phylum together
melt ← psmelt(glom) # create dataframe from phyloseq object
melt$sample_id ← factor(melt$sample_id, levels = desiredOrder) #Reorder samples (by reordering factors) of the melt dataframe
p ← ggplot(data=melt, aes(x=sample_id, y=Abundance, fill=Phylum))
p + geom_bar(aes(), stat=“identity”, position=“stack”) +theme(axis.text.x = element_text(angle = 90, vjust = 0.5, hjust=1))
Here is the final output and the original example, using Class. You’ll notice that in the glom/melted version the NA category gets turned into empty space.
Original

Made with glom/melt
